Collaborators
Project Brief
The risk of fatal crashes per driven mile is highest among teen drivers compared to other age groups. According to the CDC statistics only in 2014, 221,313 teens drivers were admitted to the emergency department and 2,333 were killed. This amounts to an average of six teen driver deaths every day due to automotive crashes. Improved safety policies are known to reduce the number of motor vehicle crashes among teens.
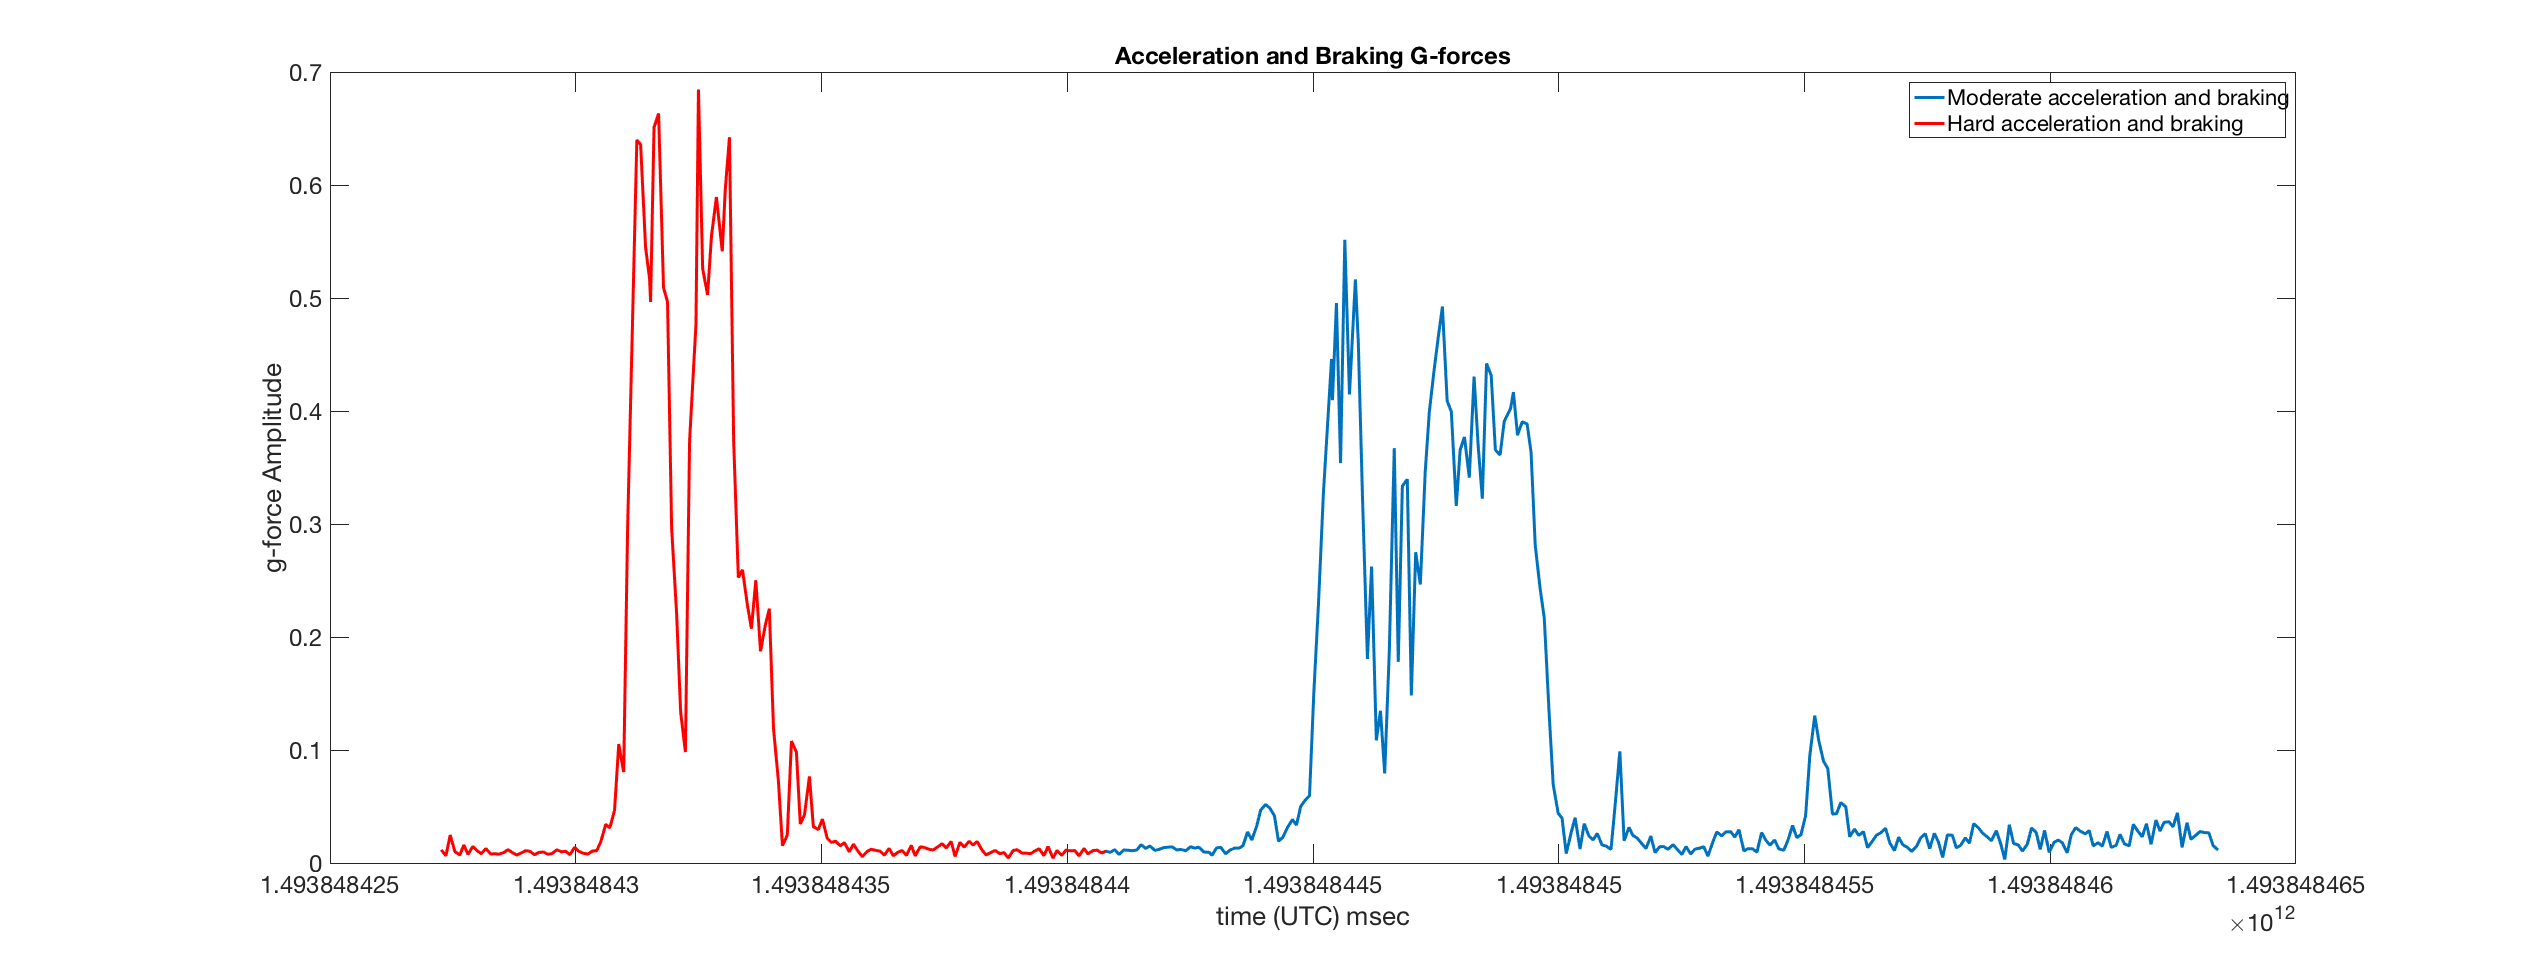
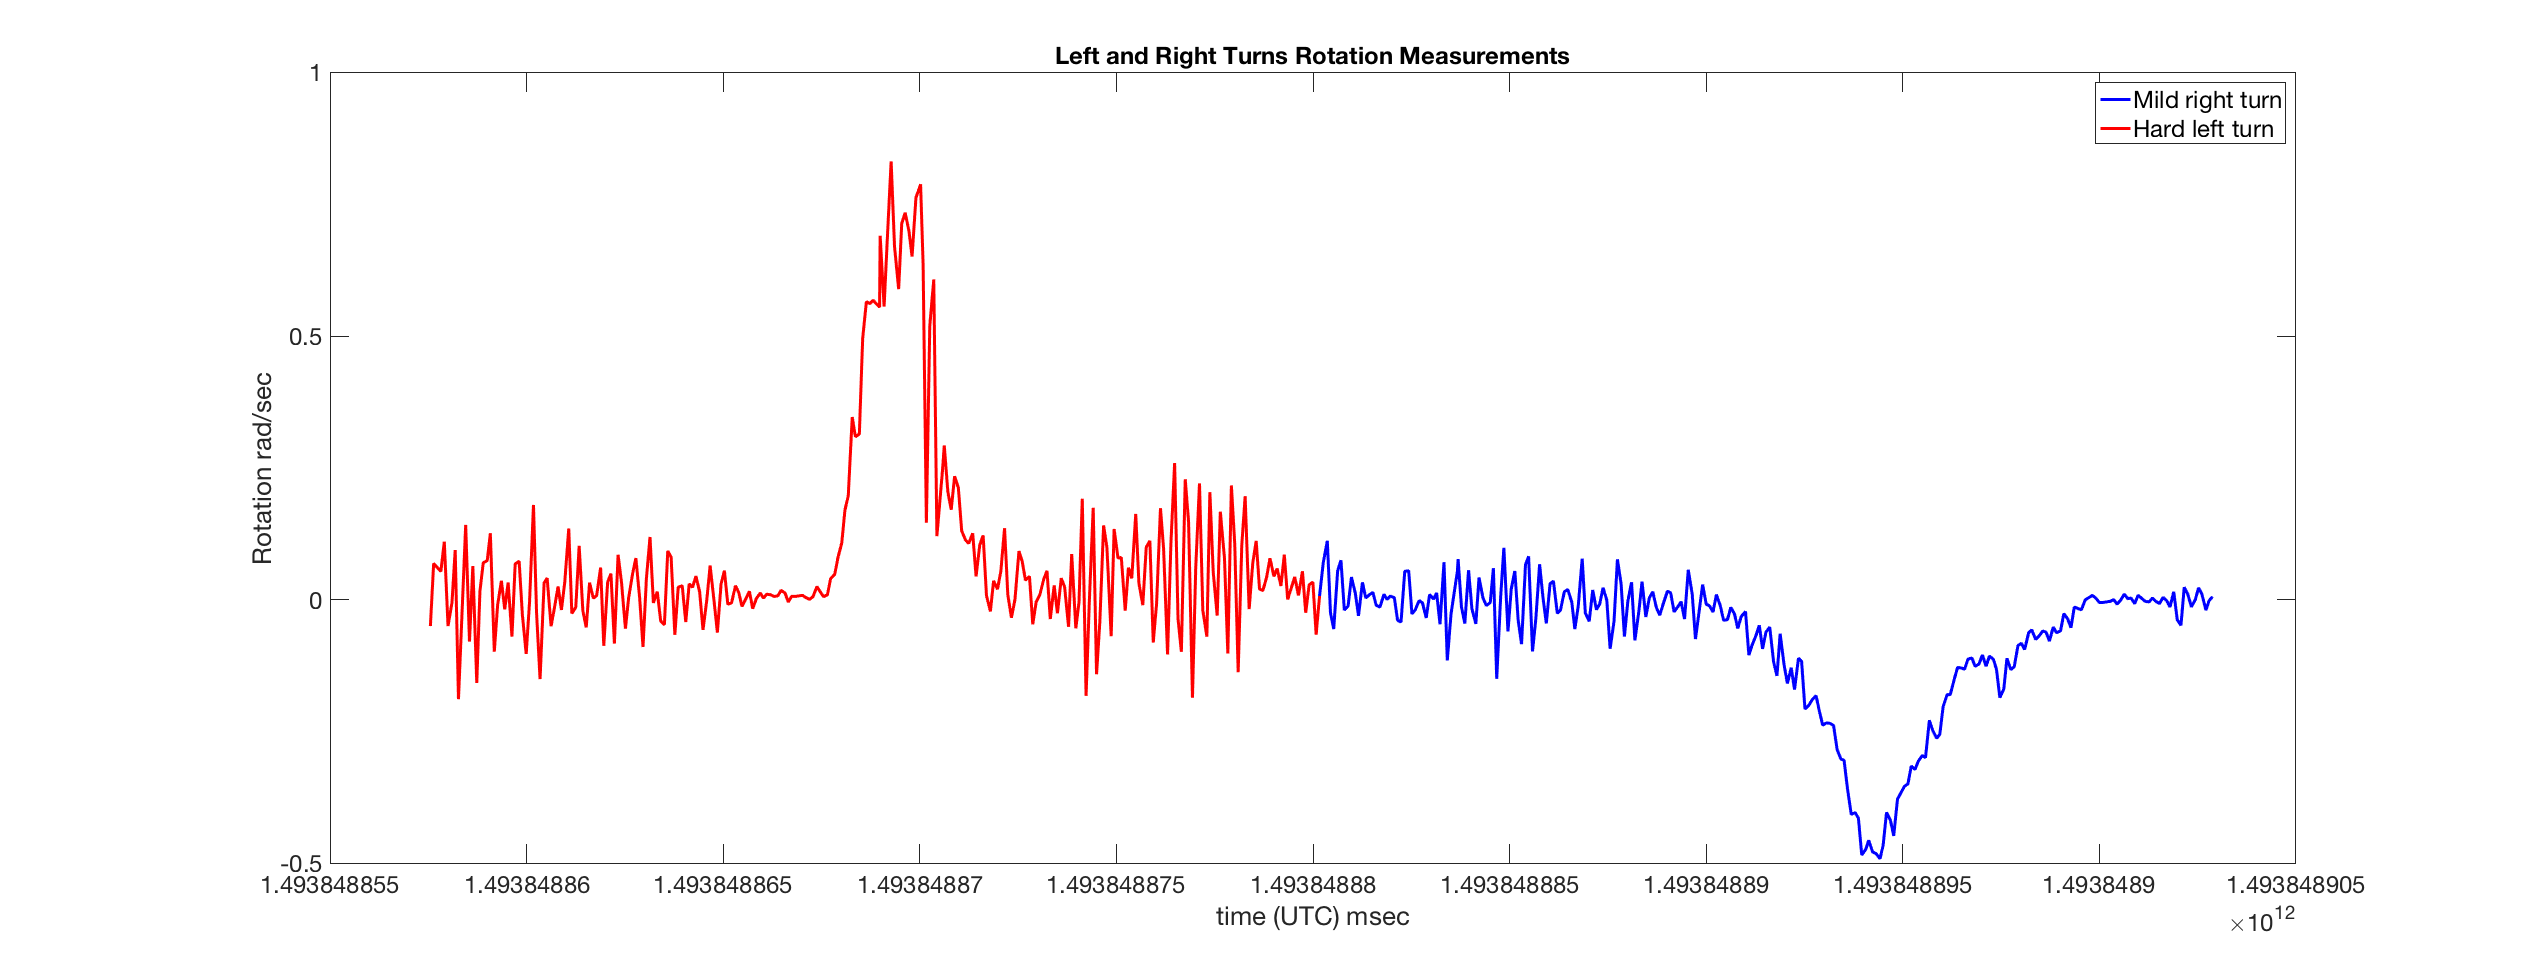
The Simons-Morton group has a long-standing interest in developing new approaches to understanding driving risk, such as the use of objective real-time in-vehicle measurements. A recent study indicates that elevated gravitational forces (g-forces) are useful when assessing driving risk, and predicting crashes and near crashes among teenage drivers. G-force and other measures have the potential to transform the way driving risk is estimated, and open the door to population-based injury prevention. The overall goal is to develop simple, non-proprietary smartphone-based tools (i.e., mHealth) to facilitate and advance driving research. By reducing the costs and other challenges associated with the collection of objective driving related data, mHealth solutions and methods could enable both increased and innovative driving research. Additionally, these innovative smartphone implementations may extend the reach of driving research to previously unmeasured populations, for example, in lower socio-economic strata and low-income countries.
Approximately three out of four teenagers in the U.S. own a smartphone. With integrated sensors, wireless communication, and computing power, smartphones could be leveraged for driving research, and perhaps also as a direct means to reduce driving risk by providing timely feedback to teens and parents. For this project, g-force events, videos and still images associated with each g-force event, mileage driven, and average speed will be captured using phone accelerometers, cameras, and global positioning system (GPS) capabilities. Furthermore, we plan to investigate the application of machine learning approaches as a means of providing novel driving assessments and predictive metrics valuable in the reduction of vehicle crashes.
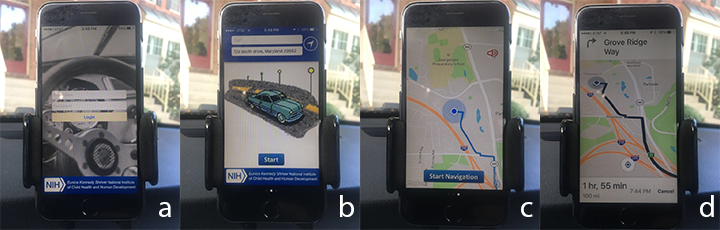
gForce Application Flowchart.