
Image analysis is a powerful tool in cell biology to collect quantitative measurements in time and space. Because microscopy imaging can easily produce terabytes of research data, accurate and automated analysis methods are key to successfully quantifying relevant information in such large image collections.
High-Performance Image Computation
Cell Nuclei Segmentation
Cell nuclei segmentation is typically the first critical step for microscopy image analysis. With accurate cell nuclei segmentation, multiple biological analyses can be subsequently performed, including cell-type classification, cell counting, and cell tracking, which provides valuable information for researchers.
We developed a Mask Regional Convolutional Neural Networks (RCNN) -based method for nuclei segmentation. Mask RCNN [1] is a state-of-the-art object segmentation framework that can identify not only the location of any object, but also its segmented mask.
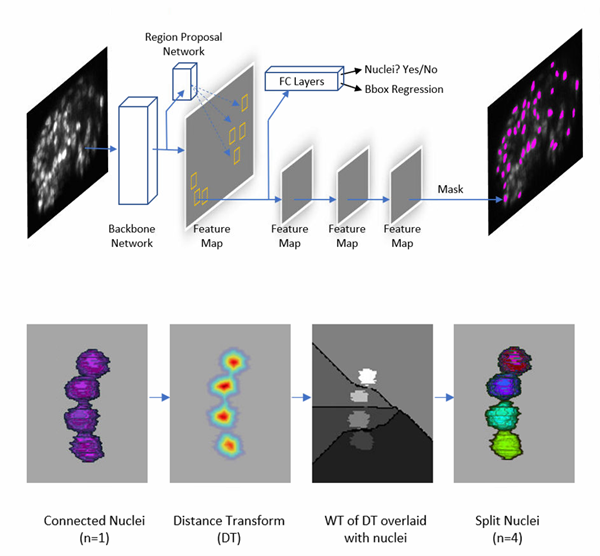
Example 1: Nuclei segmentation of an adult worm
- Triple-view line confocal imaging of an adult worm. Sample size is ~870 mm x 53 mm x 48 mm. Manual segmentation of all nuclei (n=2136) took several days/weeks.
- With our Mask RCNN-based nuclei segmentation model, segmentation of all nuclei took < 1 hour on single NAVDIA Quadro P6000 GPU.
- Compared with manually segmented nuclei, the accuracy of the Mask RCNN-based segmentation model is 94.42%.
Example 2: Nuclei segmentation of C. elegans embryos
Mask RCNN-based nuclei segmentation can be utilized for cell counting throughout the entire period of embryogenesis. Here, we integrated nuclei segmentation into a cell-tracking system to map the growth and migration of every cell in a live, developing worm embryo from fertilization to maturity.
Example 3: Evaluation of image quality of imaging systems
To quantify three imaging systems, we used Mask RCNN to segment and count the number of nuclei from 15 worm embryos. These three imaging systems included single-view light-sheet imaging (raw), single view light-sheet imaging followed by a one-step deep learning (DL) prediction (one-step DL), and single view light-sheet imaging followed by a two-step deep learning prediction (two-step DL). For the C. elegans embryonic system, the exact number of nuclei is known, as their positions and divisions were previously manually observed and scored by John Sulston with differential interference contrast (DIC) microscopy. Against the Sulston ground truth, the raw single confocal view found fewer than half of all nuclei. The two-step DL prediction fared much better, capturing the majority of the nuclei and outperforming the one-step DL prediction.
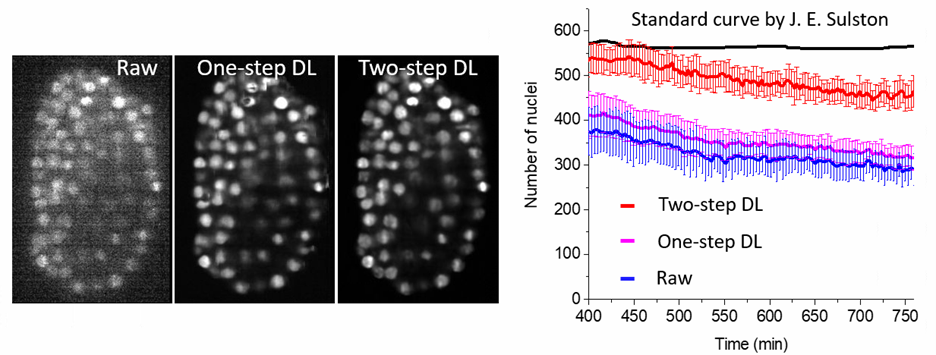
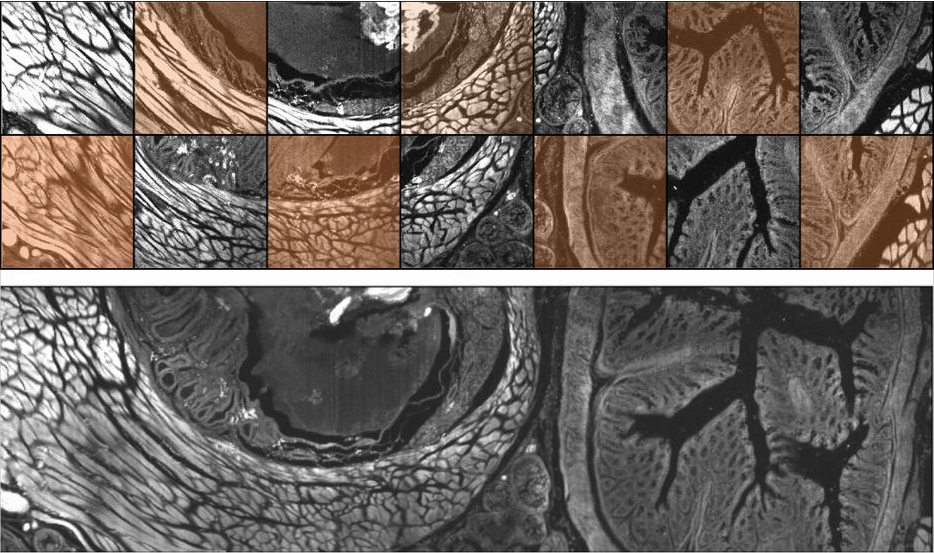
Image Stitching
We developed an image-stitching package that allows simple and efficient alignment of multi-tile, multi-view, and multi-channel image datasets, which are acquired by light sheet microscopes. This package supports images from megabyte-sized images up to terabyte-sized images, which are produced when acquiring cleared tissue samples with light sheet microscopy.
Rapid Image Deconvolution and Multiview Fusion
The contrast and resolution of images obtained with optical microscopes can be improved by deconvolution and computational fusion of multiple views of the same sample [2]. Because these methods are computationally expensive for large datasets, we have designed several software pipelines for different applications, including for rapid image deconvolution and/or multiview fusion.
Pipeline 1: Joint-view Deconvolution on Cleared-tissue Datasets
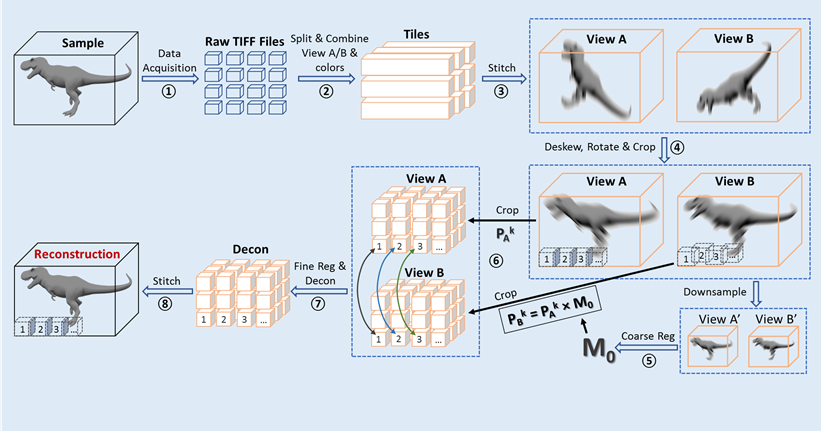
Table 1: Computation time on a pair of 3800 x 3400 x 1200 data (28G)
| Processing Type | Single Workstation Time (hr) | Biowulf Cluster Time (min) |
|---|---|---|
| Stitching Tiles | 0.5 | 15 |
| Deskew + Interpolation + Rotation | 4 | 20 |
| Subvolume Registration + Deconvolution | 7 | 30 |
| Stitching Subvolumes | 5 | 15 |
| Combined Processing Time | ~17 | 90 |
Pipeline 2: Single-view Deconvolution on Cleared-tissue Dataset
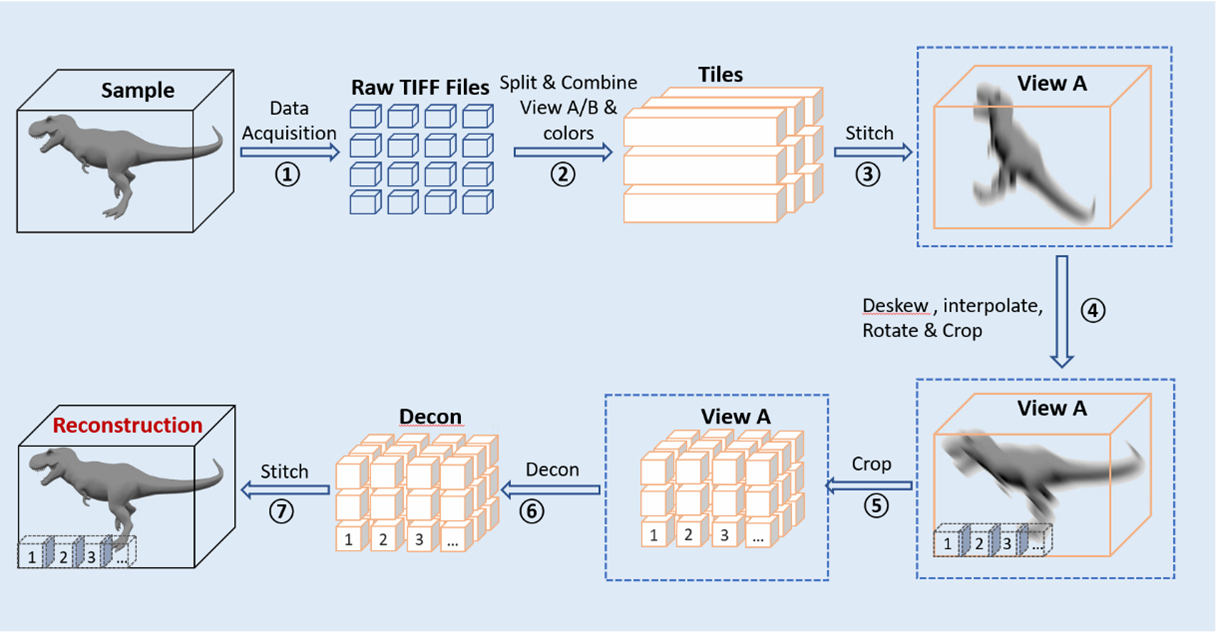
Table 2: Computation time on a pair of 3800 x 3400 x 1200 data (28G)
| Processing Type | Single Workstation Time (hr) | Biowulf Cluster Time (min) |
|---|---|---|
| Stitching Tiles | 0.5 | 15 |
| Deskew + Interpolation + Rotation | 2 | 20 |
| Subvolume Registration + Deconvolution | 6 | 20 |
| Stitching Subvolumes | 5 | 15 |
| Combined Processing Time | ~16 | 65 |
Machine Learning for Image Denoising, Resolution Enhancement, and Segmentation
Pipeline 3: Joint-view Deconvolution on Small Time Serial Data
We also developed a registration and joint-view deconvoltuion package for small data (no stitching/splitting required) with multiple time points.
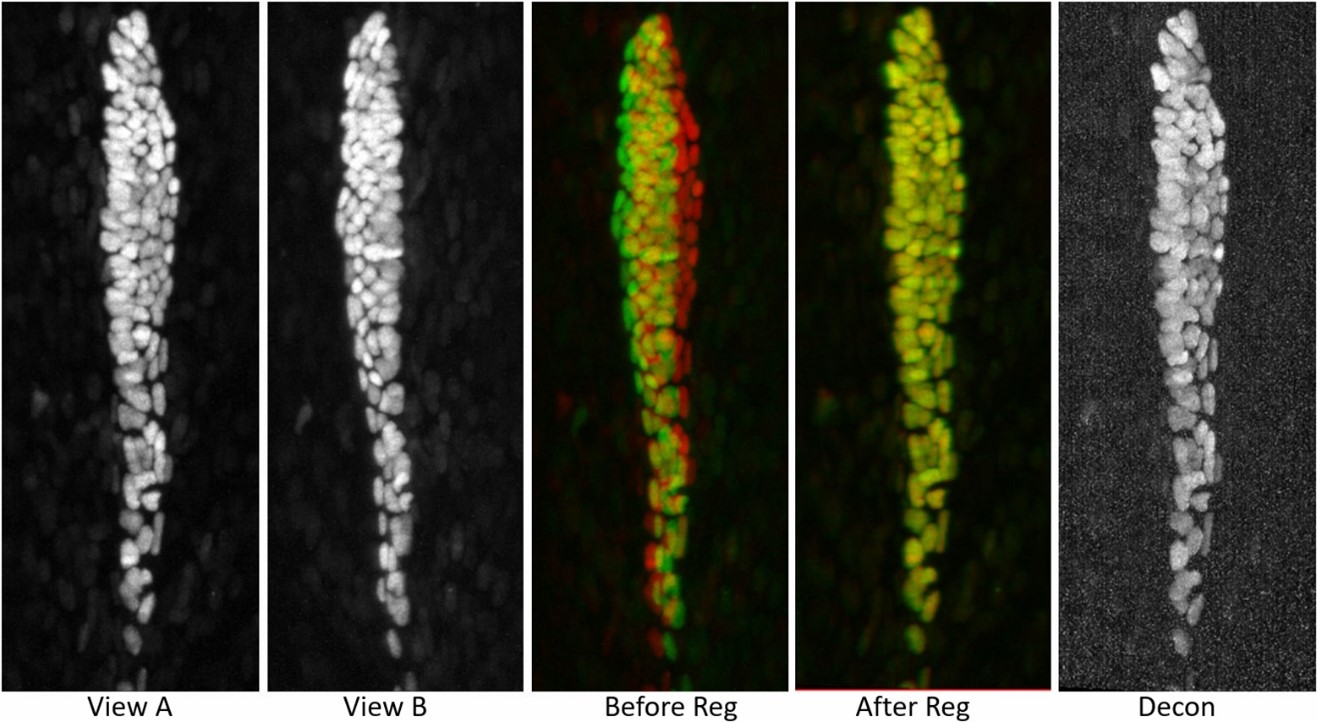
Table 3: Computation time of 1020 x 2048 x 100 (400M), 300 time points, 2 colors
| Processing Type | Single Workstation Time | Biowulf Cluster Time (min) |
|---|---|---|
| Subvolume Registration + Deconvolution (at each time point) | 4 min | 4 |
| Combined Processing Time | 300 x 4 x 2 = 40 hr | 120* |
*With multiple available GPUs, all deconcovultion jobs could be finished within 2 hours.
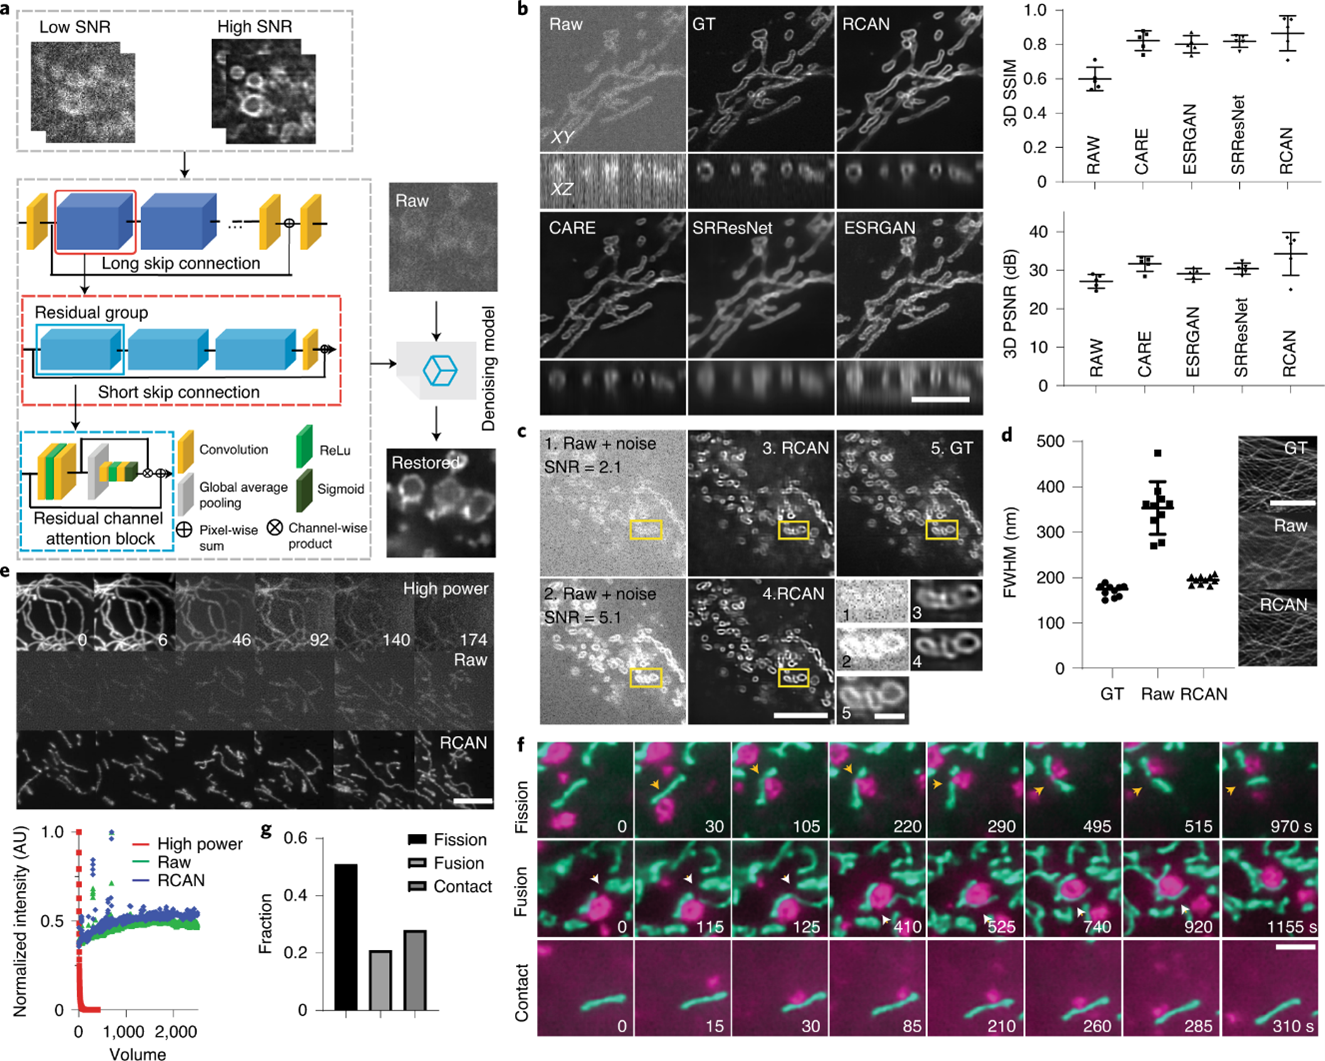
Image Denoising and Resolution Enhancement
For super-resolution microscopy applications, we use 3D residual channel attention networks (RCAN) [3]. We first extended the original RCAN to handle 3D images; this method matches or exceeds the performance of previous networks in denoising fluorescence microscopy data. We can apply this capability for super-resolution imaging over thousands of image volumes (tens of thousands of images). This method allows for RCAN and other networks to extend resolution, providing better resolution enhancement than alternatives, especially along the axial dimension. Finally, when we use stimulated emission depletion microscopy (STED) and expansion-microscopy ground truth to train RCAN models using multiple fixed- and live-cell samples, we demonstrate four-to five-fold improvement in volumetric resolution.
- Wu, Y., Han, X., Su, Y. et al. Multiview confocal super-resolution microscopy. Nature 600, 279–284 (2021). https://doi.org/10.1038/s41586-021-04110-0
- Guo, M., Li, Y., Su, Y. et al. Rapid image deconvolution and multiview fusion for optical microscopy. Nat Biotechnol 38, 1337–1346 (2020). https://doi.org/10.1038/s41587-020-0560-x
- Chen, J., Sasaki, H., Lai, H. et al. Three-dimensional residual channel attention networks denoise and sharpen fluorescence microscopy image volumes. Nat Methods 18, 678–687 (2021). https://doi.org/10.1038/s41592-021-01155-